Land Use: Adding Legend and Layer Switch to The Map
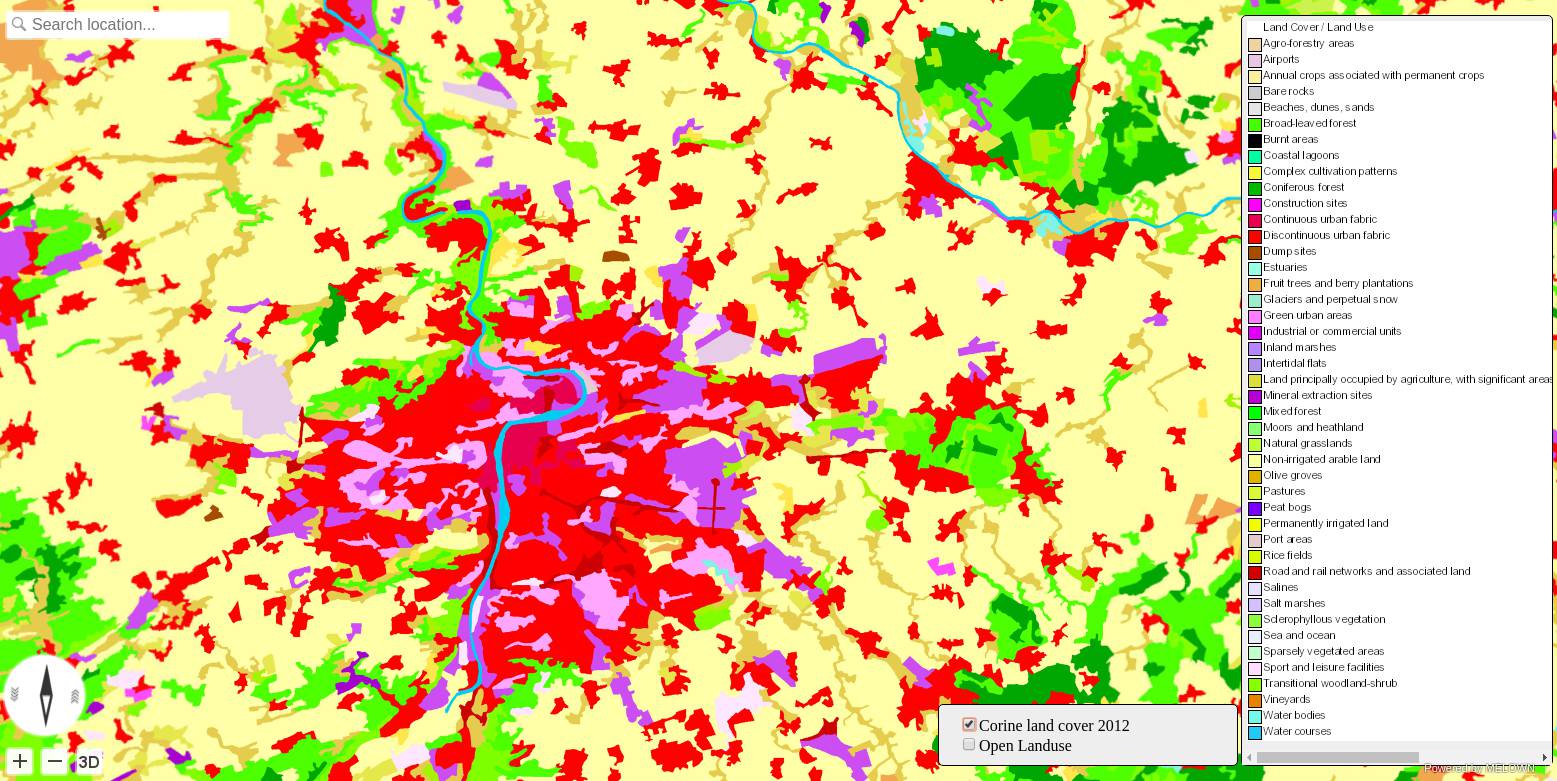
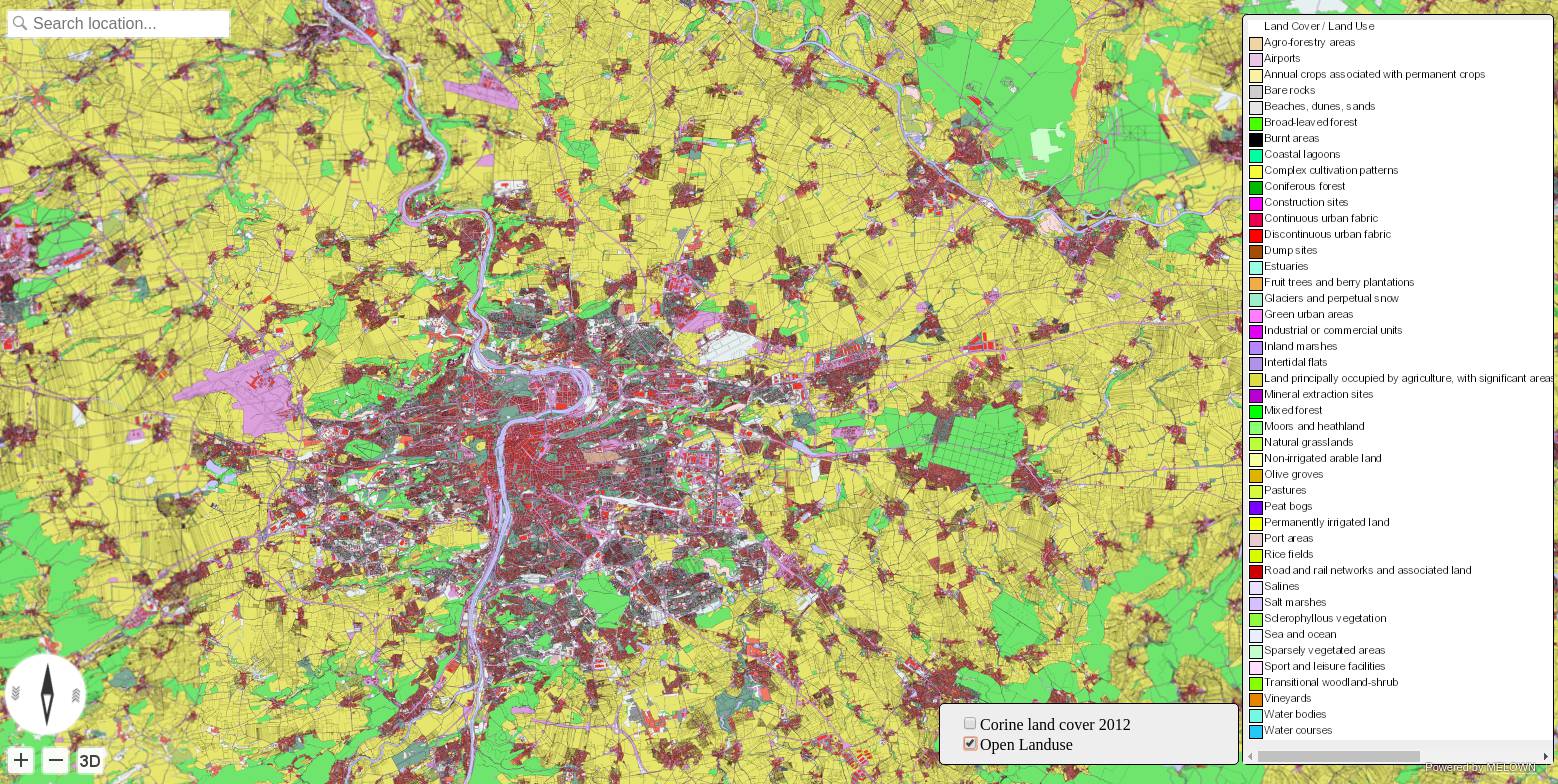
In this example, we are going to create front-end JavaScript app using the Land Use: Copernicus DEM with Urbanatlas and Corine Land Cover WMS. We are going to enrich the map with legend and a control element to switch the two landuse layers.
HTML Page
We need simple HTML web page with JavaScript included and <div> element for
the map.
1 2 3 | <link rel="stylesheet" type="text/css" href="https://cdn.melown.com/libs/vtsjs/browser/v2/vts-browser.min.css">
<!-- Include JavaScript Melown API -->
<script type="text/javascript" src="https://cdn.melown.com/libs/vtsjs/browser/v2/vts-browser.min.js"></script>
|
We also add some CSS sugar, for styling the layerswitcher, panel and legend div:
1 2 3 4 5 6 7 8 9 10 11 12 13 14 15 16 17 18 19 20 21 22 | <style>
#map-div {
width: 800px;
height: 100%;
}
.switch-panel-div {
position: absolute;
right: 320px;
bottom: 20px;
background-color: #eee;
padding: 10px 20px;
border-radius: 5px;
border: solid 1px #000;
width: 300px;
}
#legend-div {
position: absolute;
right: 5px;
bottom: 20px;
background-color: #eee;
width: 300px;
padding: 5px 5px;
|
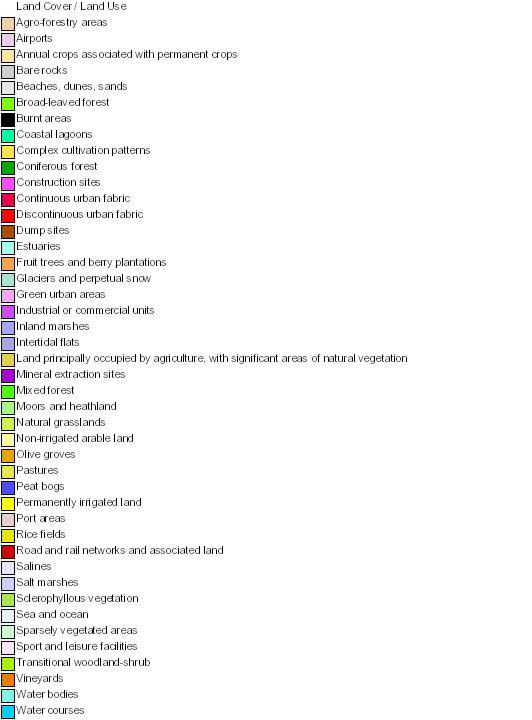
At the end of the file, we add the legend div
1 2 3 | <div id="legend-div">
<div id="corine-legend"><img src="corine-legend.png" /></div>
</div>
|
Legend image
You may know, that the OGC WMS
supports GetLegendGraphic type of request. The legend image can be obtained
using following URL: http://image.discomap.eea.europa.eu/arcgis/services/Corine/CLC2012/MapServer/WmsServer?request=GetLegendGraphic&version=1.3.0&format=image/png&layer=Corine%20Land%20Cover%202012%20raster
JavaScript code
The code is straightforward and can be downloaded from
srcs/corine.js, you have to initialize the browser with two
parameters:
- Target
<div />element ID - Map configuration JSON file
(function start() {

    browser = vts.browser('map-div', {
      map: 'http://127.0.0.1:8070/mapproxy/melown2015/surface/openlanduse/dem/mapConfig.json',
      view: {
        surfaces: {
          'openlanduse-dem': []},
        freeLayers: { }
      }
    });

    addControl();

})();
In the initializing function, addControl() function is called to create the layerswitcher panel in the map:
/**
 * Add control panel on the map canvas
 */
var addControl = function() {

    var panel = browser.ui.addControl('switch-panel',
        '<div class="switch-panel-div">' +
          '<input id="corine" type="checkbox">Corine land cover 2012</input><br />' +
          '<input id="openlanduse" type="checkbox">Open Landuse</input><br />' +
        '</div>');
    registerEvents(panel.element);

};
/**
 * Check/uncheck layerswitcher event handler
 * @param {Event} evt change event
 */
var onInputChange = function(evt) {
  var view = browser.map.getView();

  if (evt.target.checked) {
    view.surfaces["openlanduse-dem"].push("openlanduse-"+evt.target.id)
  } else {
      var idx = view.surfaces['openlanduse-dem'].indexOf("openlanduse-"+evt.target.id);
      if (idx > -1) {
        view.surfaces['openlanduse-dem'].splice(idx, 1);
      }
  }
  browser.map.setView(view);
};
Once you open the app in the web browser, it should look like the following screenshots: