GeoJSON: Import and Extending with VTS-Browser-JS
This tutorial shows how to import and visualize remote GeoJSON data and how to programmatically modify geodata with Melown VTS-Browser-JS.
This is the second part of our tutorial series about GeoJSON. At this point you should be familiar with displaying GeoJSON data and applying basic styling to them. If not, maybe you missed our previous tutorial. We highly recommend checking it out first, since this tutorial builds on top of what we did previously.
You can find the code and a live demo of this tutorial on JSFiddle.
Loading data from URL
Let’s start with a reminder of the JavaScript code from the previous tutorial.
var browser = null;
var renderer = null;
var map = null;
var geodata = null;
var geojson = {
    "type": "FeatureCollection",
    "features": [
        {
            "type": "Feature",
            "geometry": {
                "type": "Point",
                "coordinates": [-122.48347, 37.82955],
            },
            "properties": {
                "title": "Golden Gate Bridge Vista Point",
            }
        },
        {
            "type": "Feature",
            "properties": {},
            "geometry": {
                "type": "LineString",
                "coordinates": [
                    [-122.48369693756, 37.83381888486],
                    [-122.48344236083, 37.83317489144],
                    [-122.48335253015, 37.83270036637],
                    [-122.48361819152, 37.83205636317],
                    [-122.48404026031, 37.83114119107],
                    [-122.48404026031, 37.83049717427],
                    [-122.48348236083, 37.82992094395],
                    [-122.48356819152, 37.82954808664],
                    [-122.48507022857, 37.82944639795],
                    [-122.48610019683, 37.82880236636],
                    [-122.48695850372, 37.82931081282],
                    [-122.48700141906, 37.83080223556],
                    [-122.48751640319, 37.83168351665],
                    [-122.48803138732, 37.83215804826],
                    [-122.48888969421, 37.83297152392],
                    [-122.48987674713, 37.83263257682],
                    [-122.49043464660, 37.83293762928],
                    [-122.49125003814, 37.83242920781],
                    [-122.49163627624, 37.83256478721],
                    [-122.49223709106, 37.83337825839],
                    [-122.49378204345, 37.83368330777]
                ]
            }
        }
    ]
}

function startDemo() {

    browser = vts.browser('map-div', {
        map: 'https://cdn.melown.com/mario/store/melown2015/map-config/melown/VTS-Tutorial-map/mapConfig.json',
        position : [ 'obj', -122.48443455025, 37.83071587047, 'float', 0.00, 19.04, -49.56, 0.00, 1946.45, 55.00 ]
    });

    if (!browser) {
        console.log('Your web browser does not support WebGL');
        return;
    }
    browser.on('map-loaded', onMapLoaded);
}

function onMapLoaded() {
    map = browser.map;
    geodata = map.createGeodata();
    geodata.importGeoJson(geojson);
    geodata.processHeights('node-by-precision', 62, onHeightsProcessed);
}

function onHeightsProcessed() {
    var style = {
        'constants': {
            '@icon-marker': ['icons', 6, 8, 18, 18]
        },

        'bitmaps': {
            'icons': 'http://maps.google.com/mapfiles/kml/shapes/placemark_circle.png'
        },

        "layers" : {
            "track-line" : {
                "filter" : ["==", "#type", "line"],
                "line": true,
                "line-width" : 4,
                "line-color": [255,0,255,255],
                "zbuffer-offset" : [-0.5,0,0],
                "z-index" : -1
            },

            "track-shadow" : {
                "filter" : ["==", "#type", "line"],
                "line": true,
                "line-width" : 20,
                "line-color": [0,0,0,120],
                "zbuffer-offset" : [-0.5,0,0],
                "hover-event" : true,
                "advanced-hit" : true
            },

            "place" : {
                "filter" : [ "==", "#type", "point"],
                'icon': true,
                'icon-source': '@icon-marker',
                'icon-color': [0,255,0,255],
                'icon-scale': 2,
                'icon-origin': 'center-center',

                "label": true,
                "label-size": 19,
                "label-source": "$title",
                "label-offset": [0,-20],

                "zbuffer-offset" : [-1,0,0]
            }
        }
    };
    var freeLayer = geodata.makeFreeLayer(style);
    map.addFreeLayer('geodatatest', freeLayer);
    var view = map.getView();
    view.freeLayers.geodatatest = {};
    map.setView(view);
}

startDemo();
To fetch a GeoJSON we need to edit the function onMapLoaded.
function onMapLoaded() {
    map = browser.map;
    vts.utils.loadJSON('https://raw.githubusercontent.com/Melown/vts-browser-js/master/demos/geodata-geojson-import-from-url/jotunheimen_track.json', geoJsonLoaded);
}
Our VTS stack comes with the utility function vts.utils.loadJSON() to
help you downloading a JSON. However, if you favor other ways of fetching the data there
is nothing stopping you.
function geoJsonLoaded(data) {
    geodata = map.createGeodata();
    geodata.importGeoJson(data);
    geodata.processHeights('node-by-precision', 62, onHeightProcessed);
}
In the body of geoJsonLoaded() we can handle the received GeoJSON like
we did previously in onMapLoaded().
Extending existing data
VTS Browser provides an API to extend existing geodata. We’ll demonstrate this by adding a new point and a line segment to our data. Let’s start with a point.
For this purpose,
geodata
provides the methods addPoint and addPointArray, in case we want to add
multiple points at once. You can check the
documentation
to discover more.
geodata.addPoint(
    [-122.489622, 37.834831],
    'float',
    { title: 'Slackers Hill'},
    'hill-top'
);
Here we defined a new point. The first argument is an array with point
coordinates. The third coordinate is assumed to be 0 if not specified.
The second argument corresponds to the height mode. We used height
mode float because we need the point to lie on the terrain. The third
argument represents properties. We use this to specify a title for our
new location. The last argument represents an id which we’ll use to tell
the points appart. We add this snippet to
geoJsonLoaded() function right after
geodata.importGeoJson(data);.
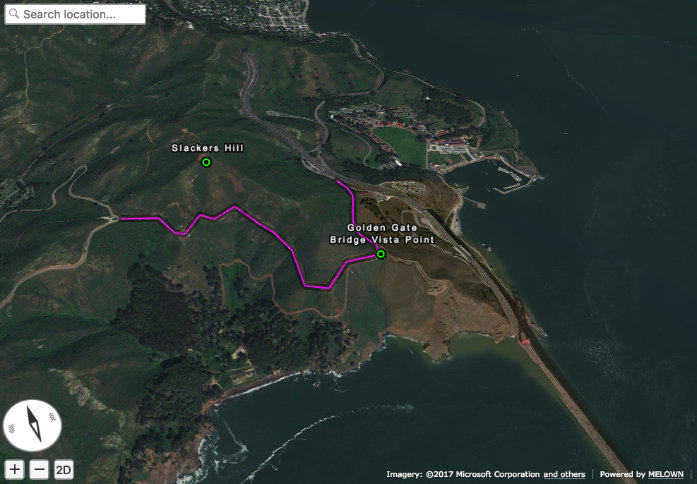
Newly added point
Next we’ll style the added point to distinguish it visually from other
points. Add the following new layer into style.layers, right after
place.
'place-hill': {
    'inherit': 'place',
    'filter': ['all', ['==', '#type', 'point'], ['==', '#id', 'hill-top']],
    'icon-color': [255,0,0,255]
    }
In this case we use layer style inheritance. You can imagine that inheritance will copy all properties from defined layer style and these properties can be overwritten by newly defined properties. This is very useful when you want share properties for other style layer and define only those properties which differ. In this case we changed only filter and icon-color properties.
Notice that we filtered the new point via it’s type and id. We have to also change filter in previously defined place layer style, because we have to prevent of rendering hill point twice.
"place" : {
    'filter' : ["all", ["==", "#type", "point"], ['!=', '#id', 'hill-top']],
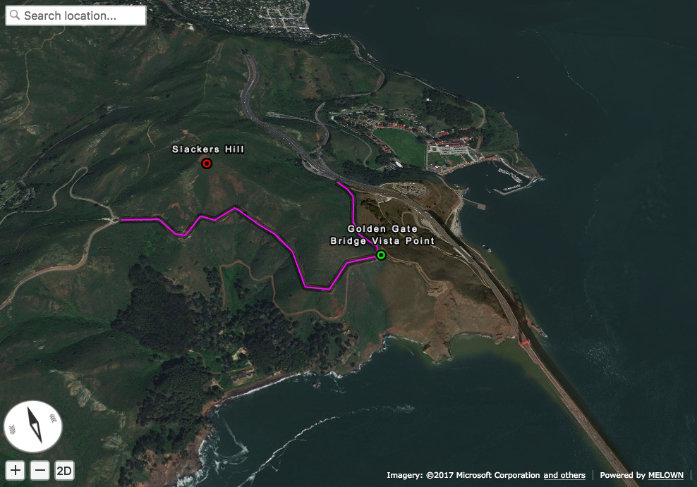
Point with changed style
Adding line segment
As a next step we’ll add a line segment via geodata API. We’ll take
advantage of
geodata.addLineString(coordinates, heightMode, properties, id).
geodata.addLineString([
    [-122.4937820, 37.833683],
    [-122.4944297, 37.834708],
    [-122.4936731, 37.835305],
    [-122.4929758, 37.835301],
    [-122.4924928, 37.835568],
    [-122.4922194, 37.836521],
    [-122.4915058, 37.836657],
    [-122.4910178, 37.836568],
    [-122.4905939, 37.836381],
    [-122.4898000, 37.836131],
    [-122.4894192, 37.835674],
    [-122.489622,  37.834831]
], 'float', null, 'track-to-hill');
We added a track up to Slacker Hill. Next we’ll make it red again. You should at this point have an idea how to achieve it yourself.
"track-line" : {
    "filter" : ['all', ['==', '#type', 'line'], ["!=", "#id", "track-to-hill"]],
    "line": true,
    "line-width" : 4,
    "line-color": [255,0,255,255],
    "zbuffer-offset" : [-0.5,0,0],
    "z-index" : -1
},

"track-extension" : {
    "filter" : ['all', ['==', '#type', 'line'], ["==", "#id", "track-to-hill"]],
    "line": true,
    "line-width" : 4,
    "line-color": [255,0,0,255],
    "zbuffer-offset" : [-0.5,0,0],
    "z-index" : -1
}
We again refactored the previous layer style track-line to omit rendering of the newly added track on it’s own. Then we added a new layer style track-extension for the newly added line segment.
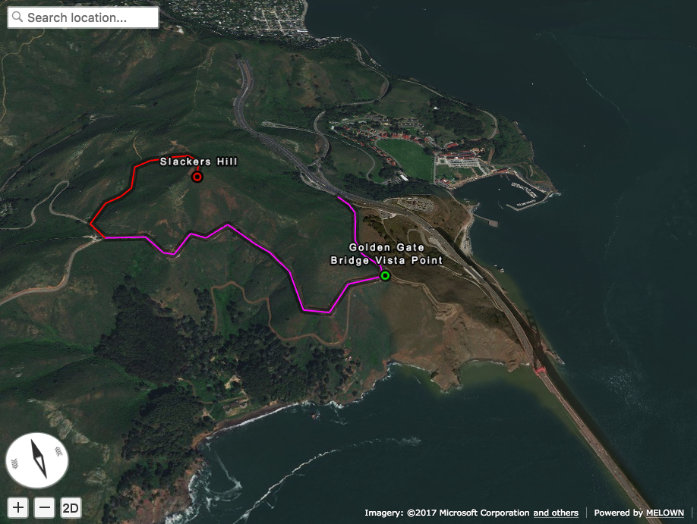
Added track
That’s it, you’ve made it to the end again! You’ve learned how to fetch a GeoJSON from a URL, add new points, lines and how to style them.
If you’d like to practice more, try to add a blue track descending from Slackers Hill to the original track’s start. You can obtain the track coordinates here.