GPX Track Viewer
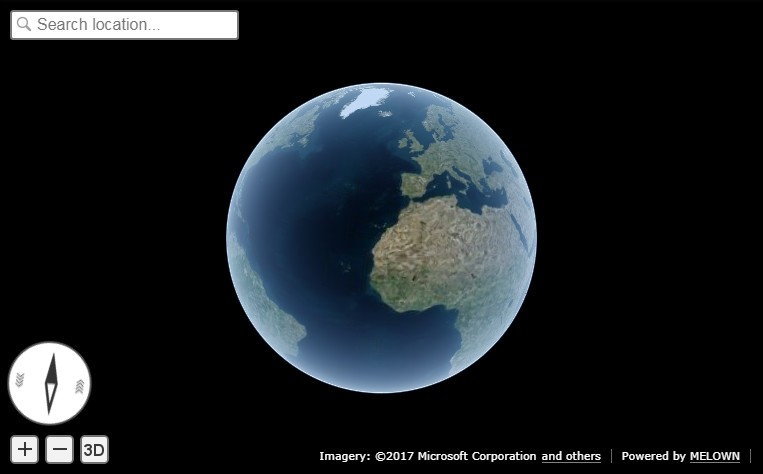
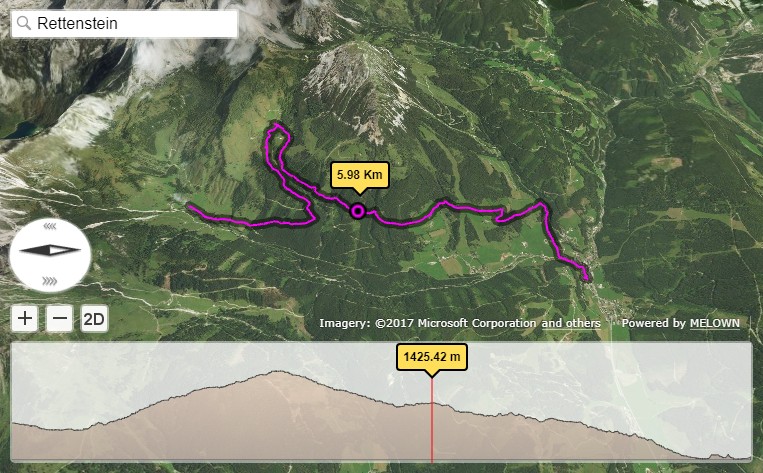
Do you want to display and explore GPX tracks in a cool 3D map? This tutorial shows how to do it with VTS-Browser-JS. Take a look at this live demo in JSFiddle. If you are curious how this is done, I will explain it in this article.
The GPX File Format
The GPX, or GPS Exchange Format, is an XML schema designed as a common GPS data format for software applications. It can be used to describe waypoints, tracks, and routes. The format is open and can be used without paying any license fees. Location data (and optionally elevation, time, and other information) is stored in tags and can be interchanged between GPS devices and software. More information about GPX format can be found on Wikipedia or at Topografix web page .
Displaying the Map
So how do we display a 3D map? With the VTS-Browser-JS library this is as easy as:
var browser = vts.browser('map-div', {
    map: 'https://cdn.melown.com/mario/store/melown2015/map-config/melown/VTS-Tutorial-Map-4/mapConfig.json'
});
This function creates a map in an HTML DOM element with ID ‘map-div’. The parameter ‘map’ sets a URL path to the map data to be displayed. You can create your own map within the Melown Cloud or you can host you own VTS Backend as shown in the backend tutorials.

Adding a New Panel to the Map Browser
The simplest way to add new UI controls to the map browser is to use the UI API.
var profilePanel = browser.ui.addControl('profile-panel',
    '<div id="profile-div" class="profile-div">' +
        '<div id="profile-canvas-holder" class="profile-canvas-holder">' +
            '<canvas id="profile-canvas" class="profile-canvas">' +
            '</canvas>' +
        '</div>' +
    '</div>');
The position and style of the new control is set by CSS:
.profile-div {
    font-family: Arial, 'Helvetica Neue', Helvetica, sans-serif;
    position: absolute;
    left: 10px;
    right: 10px;
    bottom: 10px;
    height: 122px;
    background-color: rgba(255,255,255,0.47);
    border-radius: 5px;
}
And so on. The DOM elements can by accessed the following way:
canvas = profilePanel.getElement('profile-canvas');
canvas.on('mousemove', onCanvasHover);
canvasCtx = canvas.getElement().getContext("2d");
The DOM elements are wrapped by the UI library which makes work with the elements easier. In case you want to access the original element, use the getElement method. More simple examples where the UI API is used can be found JSFiddle, follow links to example-1 and example-2 .
There is one trick by which you can move existing controls a little bit higher.
browser.ui.getControl('credits').getElement('vts-credits').setStyle('bottom', '134px');
browser.ui.getControl('space').getElement('vts-space').setStyle('bottom', '140px');
browser.ui.getControl('zoom').getElement('vts-zoom-plus').setStyle('bottom', '140px');
browser.ui.getControl('zoom').getElement('vts-zoom-minus').setStyle('bottom', '140px');
browser.ui.getControl('compass').getElement('vts-compass').setStyle('bottom', '170px');

Loading a GPX file
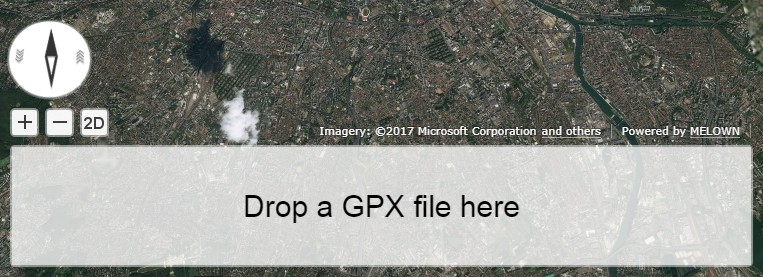
In our demo you can drop a GPX file into the map or into the panel we just created and the file is loaded magically. How is this done? In this section we add event listeners to the new panel.
canvas.on('dragover', onDragover);
canvas.on('drop', onDrop);
The dragover event is needed to prevent default browser behavior for dropping files:
function onDragover(event) {
    var e = event.event;
    e.stopPropagation();
    e.preventDefault();
    e.dataTransfer.dropEffect = 'copy';
};
The drop event provides the file the user dropped. We read this file and parse it as an XML file.
function onDrop(event) {
    var e = event.event;
    e.stopPropagation();
    e.preventDefault();

    var files = e.dataTransfer.files;

    for (var i = 0; i < files.length; i++) {
        var reader = new FileReader();

        reader.onloadend = function (event) {
            var parser = new DOMParser();
            var data = parser.parseFromString(event.target.result, 'text/xml');
            loadGPX(data);
        };

        reader.readAsText(files[i], 'text/plain');
    }
}
Once the XML file is loaded, we can extract features by DOM methods like getElementsByTagName, etc., according to the format specification.
Displaying the Geodata
Now that we have geographic data, we can display them in the map using the Geodata API. First we create a geodata object.
geodata = map.createGeodata();
Now we can add some points. Note that we are using ‘float’ height which defines height above terrain. If we had elevation data we could use ‘fix’ height which has no relation to the terrain. The point can also be assigned properties which can be accessed by geodata styles.
geodata.addPoint([14.3836691, 50.0485568, 500], 'float', { 'name' : 'Nice place' });
Similarly we can add a line string. Note that we are giving it an id ‘some-path’. We will need that later for extracting geometry.
geodata.addLineString([
    [13.4836691, 49.6285568, 0],
    [13.8559398, 49.2926023, 0],
    [14.3590684, 49.1136598, 0],
    [15.2561336, 49.0637509, 0],
    [15.8564221, 49.2444548, 0],
    [16.2429312, 49.5161402, 0]
], 'float', null, 'some-path');
Once we added all features to the geodata, we can convert ‘float’ heights to ‘fix’ heights. This process can take some time because terrain data has to be loaded. The following asynchronous function is used for the conversion. In case you used ‘fix’ height you don’t have to call this function.
geodata.processHeights('heightmap-by-precision', 1, onHeightProcessed);
The second function parameter sets the desired resolution of the heightmap from which the heights are read. The value represents the size of height sample in meters.
Once our geodata is ready we can create a map layer with vector features. In VTS terminology such layer is called a free layer because it is independent of other surfaces.
The vector features can be styled with geodata styles. A style has a set of internal layers to be rendered. Each style layer has a filter with a condition that determines which features will be rendered in that layer. Note that in our example the style layer ‘track-shadow’ has properties ‘hover-event’ = true and ‘advanced-hit’ = true. These events will be explained later.
var style = {
    "layers" : {
        "track-line" : {
            "filter" : ["==", "#type", "line"],
            "line": true,
            "line-width" : 4,
            "line-color": [255,0,255,255],
            "zbuffer-offset" : [-5,0,0],
            "z-index" : -1
        },

        "track-shadow" : {
            "filter" : ["==", "#type", "line"],
            "line": true,
            "line-width" : 20,
            "line-color": [0,0,0,120],
            "zbuffer-offset" : [-5,0,0],
            "hover-event" : true,
            "advanced-hit" : true
        },

        "way-points" : {
            "filter" : ["==", "#type", "point"],
            "point": true,
            "point-radius" : 20,
            "point-color": [0,255,255,255],
            "zbuffer-offset" : [-5,0,0]
        },
    }
};
Now we can create a free layer and add it to the map. The map will keep the free layer under the id ‘gpxgeodata’.
var freeLayer = geodata.makeFreeLayer(style);
map.addFreeLayer('gpxgeodata', freeLayer);
Just adding the free layer to the map will not display it. To make that happen we need to include the free layer in the current map view,
var view = map.getView();
view.freeLayers.gpxgeodata = {};
A simple example which shows how to display geodata can be found at JSFiddle.
How to Center Map Position to the Track
We need to find the coordinates of the center of all track points. For this purpose we have to extract track coordinates. It is important to use extracted coordinates because they will be in the right coordinate system (physical SRS). Keep in mind that we can extract track geometry only after heights are processed (method processHeights was called).
The geodata feature with id ‘some-path’ is found and its geometry extracted:
lineGeometry = geodata.extractGeometry('some-path');
The total number of line segments is returned by this method:
totalElements = lineGeometry.getElements();
A particular line segment is returned by this method:
lineSegment = lineGeometry.geometry.getElement(lineSegmentIndex);
Line segments points:
p1 = lineSegment[0];
p2 = lineSegment[1];
Now we find average coordinates of all line points and convert that coordinates to navigation SRS. In this case we can ignore the resulting height and set that height to zero.
navCoords = vts.proj4(physicalSrsDef, navigationSrsDef, midPoint);
navCoords[2] = 0;
We have center coordinates, but we also have to zoom appropriately. To do that we need to find the right view extent. A simple approach is as follows. Imagine a line which goes from the center point and is perpendicular to the ground. We find the most distant track point from that line. We multiply this distance by two and that is that. Now we can set the new map position:
var pos = map.getPosition();
pos.setCoords(navCoords);
pos.setOrientation([0, -70, 0]);
pos.setViewExtent(viewExtent);
map.setPosition(pos);
Hit Testing the Displayed Track
The track is displayed. Now we want to know whether the cursor is hovering over the track. Easy. Do you remember when added the property ‘hover-event’ = true to the ‘track-shadow’ style layer? Now we just need to listen to these events:
browser.on('geo-feature-hover', onFeatureHover);
But these events will be generated only when we keep informing the map about the current cursor position by calling the ‘hover’ method. This gives you absolute control over the generation of hover events.
mapElement.on('mousemove', onMouseMove);
mapElement.on('mouseleave', onMouseLeave);

...

function onMouseLeave(event) {
    var coords = event.getMouseCoords();
    map.hover(coords[0], coords[1], false);
};


function onMouseMove(event) {
    var coords = event.getMouseCoords();
    usedMouseCoords = coords;
    map.hover(coords[0], coords[1], true);
}
You are probably wondering about the third parameter in the ‘hover’ method. We need to generate hover events even when the cursor is not moving, which is what the parameter does when its value is ‘true’. When the cursor leaves the map we pass ‘false’ to stop generating hover events.
Now we have the callback function onFeatureHover which is called when the cursor hovers over the track. What is next? We have to figure out over which part of the track is the cursor hovering. The function onFeatureHover is called with an event parameter that contains - among others - a property named ‘element’ which is the index of the line segment we are hovering over. Note that the style layer of the feature needs to have the property ‘advanced-hit’ = true for this to work.
To get a precise location and distance of the cursor on the track we use the getRelationToCanvasPoint method, which returns information where the cursor is located on the line segment. This information contains the distance property which has values from 0 (line segment start) to 1 (line segment end). We multiply this value by line segment length (obtained by getPathLengthToElement method) and add that value to the total path length to the segment (also obtained by getPathLengthToElement). When we know the total distance to the point on the track we can get the coordinates of this point by the getPathPoint method. We don’t strictly need to use this function to get the coordinates, because getRelationToCanvasPoint returns these as well, but this is sort of a double check.
function onFeatureHover(event) {
    lineSegment = event.element;

    var res = lineGeometry.getRelationToCanvasPoint(lineSegment, usedMouseCoords[0], usedMouseCoords[1]);
    var lineSegmentInfo = lineGeometry.getPathLengthToElement(lineSegment);

    pathDistance = lineSegmentInfo.lengthToElement + (lineSegmentInfo.elementLengh * vts.math.clamp(res.distance, 0, 1));
    linePoint = lineGeometry.getPathPoint(pathDistance);

    setProfilePointer(linePoint);
    map.redraw();
}
For reference, here is a simple events example.
Displaying Dynamic Features on the Map
Geodata is very good for displaying static content. But when it comes to rendering dynamic features we can use a combination of HTML elements and the rendering API.
We will start with the HTML part fist. HTML elements are great for displaying info boxes, etc., so why not use them for this purpose. To keep things organized we create a new UI control which will hold an HTML element.
var infoPointers = browser.ui.addControl('info-pointers',
    '<div id="distance-div" class="distance-div">' +
    '</div>');

distancePointer = infoPointers.getElement('distance-div');
Now we can modify the element style to move it to the desired screen coordinates:
distancePointer.setStyle('left', screenX + 'px');
distancePointer.setStyle('top', screenY + 'px');
How do we get screen coordinates? We already know coordinates in the physical SRS, so we just need to convert them to screen coordinates.
var screenCoords = map.convertCoordsFromPhysToCanvas(linePoint);
HTML elements are great but they can be slow when you draw a lot of them. Another disadvantage is that they do not respect the depth buffer of the rendered map. This means that when some feature is behind a building or a hill it will still be visible. In these cases we can use the rendering API.
The first thing we need to do is to set up a rendering callback. This callback is invoked when the map is ready for rendering additional content.
map.addRenderSlot('custom-render', onCustomRender, true);
map.moveRenderSlotAfter('after-map-render', 'custom-render');
In the callback we can draw an icon of a track point.
function onCustomRender() {

    renderer.drawImage({
        rect : [screenX, screenY, ImageWidht, ImageHeight],
        texture : pointTexture,
        color : [255,0,255,255],
        depth : screenZ,
        depthTest : false,
        blend : true
        });
}
A simple example showing how to render dynamic features can be found at JSFiddle .
Displaying Track Height Profile
How do we get the height profile of the track? We are able to get track geometry in physical SRS. From that geometry we can get the length of each line segment and the total length of all line segments together. The next thing are heights for each track point. We are able to do that by converting point coordinates from the physical SRS to the so called public SRS, which is normally lat-lon coordinates plus height above sea level (at least in melown2015 reference frame. We collect heights of all track points and together with line segment lengths we can plot the height profile. The easiest way to plot the profile is to use HTML Canvas.
